Aug 4, 2017
Dear Daily Pfennig Readers…
It’s our pleasure to be here, filling in for our dear friend Chuck Butler while he’s on vacation.
To introduce ourselves, we’re Mary Anne and Pamela Aden. We write The Aden Forecast letter, and we’ve been happily doing this for 36 years. We cover the major markets, and we’ll be posting some of our articles here.
We also publish Dow Theory Letters. It was founded by the late great Richard Russell and, along with a team of top notch writers, we’ve carried on with his work. Some of these articles will also be posted during Chuck’s R&R.
And finally, you’ll also be receiving articles from GoldChartsRUs, our weekly trading service. Here our top trader covers what to buy, what to avoid, what to do about it and much more.
We hope you enjoy our articles while Chuck’s away.
Chuck’s transition is complete and we’re proud to have him as part of our Aden Group.
Best regards and here’s to good markets,
Mary Anne & Pamela Aden
Today we’re posting an article from Gold Charts R Us.

GOING OUR WAY
Gold rose further this week, reaching an eight-week high yesterday on doubts whether the Fed will raise rates this year as inflation remains subdued per the Fed’s gauges.
Also adding to gold’s luster is intensifying geopolitical turmoil as tensions with North Korea and Russia continue to escalate. In the meantime, the U.S. dollar continues to decline sharply easing the grip on deflationary forces and pushing resources, stocks and precious metals upward.
Most noticeable was crude oil as it reached our first profit target allowing you to secure a 15% gain on half of your position this week.
Copper also edged higher reaching new highs for the move yet again.
The stock market, especially the Industrials, also jumped up to more record highs on good earnings and after the Fed left interest rates alone last week. Yet the Transports declined from the highs likely on higher oil prices as profit margins were seen to fall. Moreover, Transports remain above key support levels and the bullish Dow Theory confirmation remains in play.
The Fed is dominating the markets, and one unknown is how the markets will react when the Fed starts reducing its massive debt on its balance sheet which is scheduled to start, as they said, “relatively soon.”
Meanwhile, gold looks poised for more upside. Gold’s ‘C’ rise hit a higher gear after breaking above $1260. And its next key “make or break” resistance level is near $1300, the previous ‘A’ double peak.
Our Chart of the Week shows gold, the euro and the U.S. dollar index and their relationship.
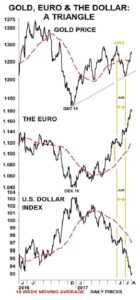
Note gold and the euro moving together and opposite to the dollar over the past year. Gold and the euro have been rising together since the Dec 2016 lows while the dollar started its descent.
But something odd happened in June. Gold abruptly fell while the euro jumped up to a new high, and the dollar fell to a new low.
We don’t think it’s a coincidence that two unusual slip-ups occurred in Jun-early July. The first was an alleged ‘fat finger’ mistake that pushed gold down, and then silver’s “flash crash”. In fact, the “flash crash” pushed both gold and silver down to their lows on Jul 7. This was the low for the move; see second yellow vertical line on chart.
Aside from that month long set back, they’re all back to moving in sync. That is, gold and the euro rose together while the dollar fell to a 15 month low on Monday. You could say if it wasn’t for the “mistakes”, gold could’ve been much higher today. Of course we’ll never know.
You’re probably thinking, yeah, but what about the euro and the dollar, aren’t they about ready to have a breather? They are, and they’re very overextended. But gold isn’t.
To read more about Gold Charts R Us, click here.